Climate Migration: The Numbers
There are catastrophic migration consequences of the climate crisis, some that have already occurred and many that are approaching. In 2020 alone, more than 30 million people were displaced within their own countries because of natural disasters. This number is likely only to grow, as extreme weather events are only getting worse as we continuously fail to properly take action against climate crisis.
In 2020, more than 30 million people were displaced within their own countries from natural disasters
An Essential Perspective: The Global North and Global South
Climate change and climate migration do not affect all populations and countries equally. In general, countries and populations in the Global South are more likely to be negatively impacted by climate change than those in the Global North, despite the Global North being primarily responsible for emissions and therefore climate change.
The Global North and Global South perspective is a way to look at the world through the lens of historical economic and social disparities. It is especially useful for considering the causes and impacts of climate change. The Global North, which generally speaking, consists of countries in the northern part of the world, is more economically developed than the Global South because of a long history and legacy of colonialism. These countries, many of which are in North America and Europe, are more politically and economically powerful. Because of this, they are also overwhelmingly responsible for the greenhouse gas emissions in our atmosphere, thus making them major drivers of climate change. But even though they are largely responsible for the current state of our crisis, it is widely understood that they are not facing its effects to the same extent that those in the Global South are and are not actually facing consequences for their disproportionate emissions.
There is no set definition of the Global North and Global South, nor is there an agreed-upon list identifying the global region every country and territory belong to. To identify the countries belonging to the Global North and Global South, this page considers members of the OECD as belonging to the Global North. The OECD, the Organisation for Economic Co-operation and Development is an international economic organization seeking to boost economic development globally and trade, so many of its member countries are highly developed and are considered high income.
Climate Risk and Germanwatch Analysis
Countries facing higher threats from climate change and countries that are not able to adapt to these threats are going to have more climate migrants because their population is less safe from climate risks than those in other countries.
When considering the climate risks that countries are facing, a reliable source is the Germanwatch Global Climate Risk Index. Germanwatch is an environmental NGO concerned with the disproportionate impact of the climate crisis on the Global South. Each year, Germanwatch considers the fatalities and economic losses caused by extreme weather events in each country to calculate a climate risk index score and determine which countries are at highest risk under the threat of extreme weather events. These criteria includes the total number of fatalities per 100,000 residents, the total financial losses, the percentage of the country’s GDP that has been lost, and the number of extreme weather events.
When looking at these scores, it’s important to note that lower scores indicate a higher risk. It is also essential to note that due to research limitations, not all countries are represented in Germanwatch’s Global Climate Risk Index, including some small countries and territories that may actually be significantly facing high risks of climate change.
According to the 2021 Global Climate Risk Index, the ten countries or territories that have been at the highest risk from extreme weather events (called the Bottom 10) between 2000 and 2019 are the following:
1. Puerto Rico*
2. Myanmar
3. Haiti
4. The Philippines
5. Mozambique
6. The Bahamas
7. Bangladesh
8. Pakistan
9. Thailand
10. Nepal
*US territory
Of the Bottom 10, only Puerto Rico is considered to be part of the Global North. Though it’s the country or territory that has been most at-risk from climate change for the past 20 years, this list shows that generally the majority of countries and territories facing the highest risks are in the Global South. Though distributions of Climate Risk Index scores show similar patterns between the Global North and the Global South, many of the absolute highest risk countries and territories belong to the Global South.
According to Germanwatch analysis, much of the threat that put Puerto Rico and Myanmar at the top of the most at-risk countries and territories over the past 20 years were caused by single one-off catastrophic events rather than continuous extreme weather events: Hurricane Maria and Cyclone Nargis.
The most significant threat to those at highest risk appears to be storms and extremely high precipitation levels and the consequences that arise from them, like flooding and landslides. Six of the Bottom 10 countries and territories were greatly affected by tropical cyclones that resulted in them being considered high risk of being affected by extreme weather events.
Even beyond just the most at-risk countries, Germanwatch research suggests that flooding is the most destructive extreme weather event globally.
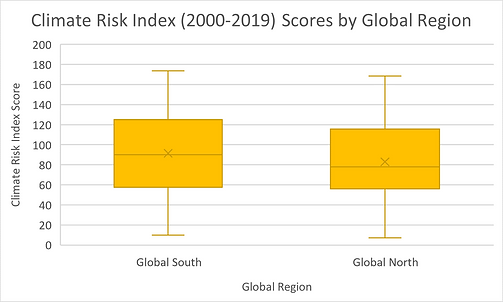
This graph shows the distribution of climate risk index scores in the Global North and in the Global South. As shown in the graph, the median CRI score for the Global South is lower than the median CRI score for the Global North, and the Global South distribution is slightly lower overall than the Global North distribution. This indicates that countries in the Global South are facing slightly higher climate risks than those in the Global North, but the difference between the two global regions is minimal.

This graph shows countries’ climate risk index scores by their income classification, as determined by the World Bank. In general, lower-middle income countries have the lowest CRI scores, indicating that they are facing the highest risk from extreme weather events caused by climate change.
Map of Climate Risk Index scores (2000-2019) by country. Lower scores indicate more risk under the threat of extreme weather events. Data from Germanwatch. Scroll over map to investigate CRI scores of each country and territory.
(International) Climate Migration Estimations
International climate migration is cross-border migration driven by environmental factors, both rapid-onset events and more long-term changes in the environment. It is much more difficult to collect data on, or even estimate, than internal climate migration because of the cross-border nature of the issue. Thus, while we are able to consult more accurate data and estimations on internal climate migration, the information available about international climate migration is limited and we must rely on less accurate projections for total climate migration.
The widely understood estimate, as projected by the UK government in the Stern Review on the Economics of Climate Change in 2006, is that there could be 150 to 200 million climate migrants (internal and international) by 2050. However, as is discussed further down, some more recent estimates, like those from the World Bank, point to more than 200 million internal climate migrants alone by 2050. A more recent prediction comes from the thinktank Institute for Economics and Peace, which estimated that 1.2 billion people are at risk of becoming climate migrants in the next 30 years.
Though these numbers are projections, they make clear just how severe the threat of climate change is and how many people may be displaced by it, both within their own country and in other countries. Climate migration, internal and international, is a crisis we are already facing and is only expected to get worse as the environmental effects of climate change become more intense and widely felt.
1.2 billion people are at risk of being climate migrants in the next 30 years
Internal Migration Data
Estimating, much less measuring, internal climate migration is much more feasible than doing the same for international migration caused by climate change. As such, there is more data available about internal climate displacements than there is about international climate migration. This 2020 data from the Internal Displacement Monitoring Centre is displayed on the graph below.
Map of new internal displacements caused by natural disasters in 2020. Data from Internal Displacement Monitoring Centre. Scroll over map to investigate internal displacements of each country.
Total number of internally displaced people from natural disasters in 2020
Median number internal migrants from natural disasters per country
Most internal migrants from one country
30,686,574
6,600
5,073,195 (China)
Analyzing the data from the Internal Displacement Monitoring Centre reveals that climate change-driven internal displacement is a reality for many people around the world. Though many countries have relatively low climate change-driven internally displaced populations, there are countries like China, India, Bangladesh, the Philippines, United States, and Vietnam with more than a million or several million internal migrants that have been displaced by natural disasters in 2020 alone.
It is certainly worth noting that many of these countries with the largest internally displaced populations resulting from natural disasters are in the Global South. Though some of these countries, like China and India have very large populations in general, these countries are more broadly facing the brunt of the consequences of climate change, resulting in many of their residents having to move to other parts of the country.
Modeling Internal Climate Migration
The Internal Displacement Monitoring Centre offers a model of internal displacement around the world or in specific regions. These models consider the average annual displacement if certain natural disasters or extreme weather events were to occur. They can also show how people from different income groups will be displaced at higher numbers than other income groups.
For instance, if one were to look at the world and extreme weather events caused by climate change more broadly, using the model, you would notice that the lower middle followed by the lower income would be displaced at the highest average annual rates. Considering all the possible natural disasters, the model offered by the Internal Displacement Monitoring Centre indicates that more than 8 million lower-middle-income people could be internally displaced each year. As you would likely expect, the high-income group would be displaced at the lowest average annual rates.
Screenshot of the displacement model from the Internal Displacement Monitoring Centre. This view shows the average number of people that could be displaced annually by extreme weather events and natural disasters, by the country’s income category.

Screenshot of the displacement model from the Internal Displacement Monitoring Centre. This view shows the average number of people per 100,000 that could be displaced annually by extreme weather events and natural disasters, by the country’s income category.

This analysis indicates a major contributing factor of internal displacement caused by climate change: income. In general, people with lower incomes are more likely to be displaced than those with higher incomes. As shown in the graphics above, low income and lower-middle income countries are projected to have nearly double the internal climate migration rates of upper-middle income and high income countries.
Furthermore, according to the models from the Internal Displacement Monitoring Centre, flooding is the greatest risk for internal climate migration, particularly for countries outside of the high income category. Flooding is projected to be the cause of the majority of internal climate migration in those countries.
The World Bank’s 2018 report on internal climate migration, Groundswell, offers projections of internal climate migration by 2050 for three countries of interest. These projections are based on three scenarios— pessimistic, more inclusive, and more climate-friendly— are displayed in the table below.
Average Number of Climate Migrants, by Scenario
Region
Sub-Saharan Africa
South Asia
Latin America
Pessimistic
71.1 million
35.7 million
10.6 million
More Inclusive
53.3 million
21.1 million
10.5 million
More Climate-Friendly
28.3 million
16.9 million
5.8 million
Groundswell II, the World Bank’s 2021 report on acting on internal climate migration predicted that by 2050, there would be 216 million climate migrants worldwide. This information, with internal migrants categorized by region, is displayed in the infographic from the World Bank below.

These estimates make it clear that internal climate migration is not, and will not be, evenly spread throughout the world. While Eastern Europe and Central Asia are projected to have 5 million climate migrants by 2050— still a very large number— this is only a fraction of the projected internal climate migrants from Sub-Saharan Africa, which is estimated to be 86 million by 2050.